UfO and Sky Brightness Map
Background and Methods:
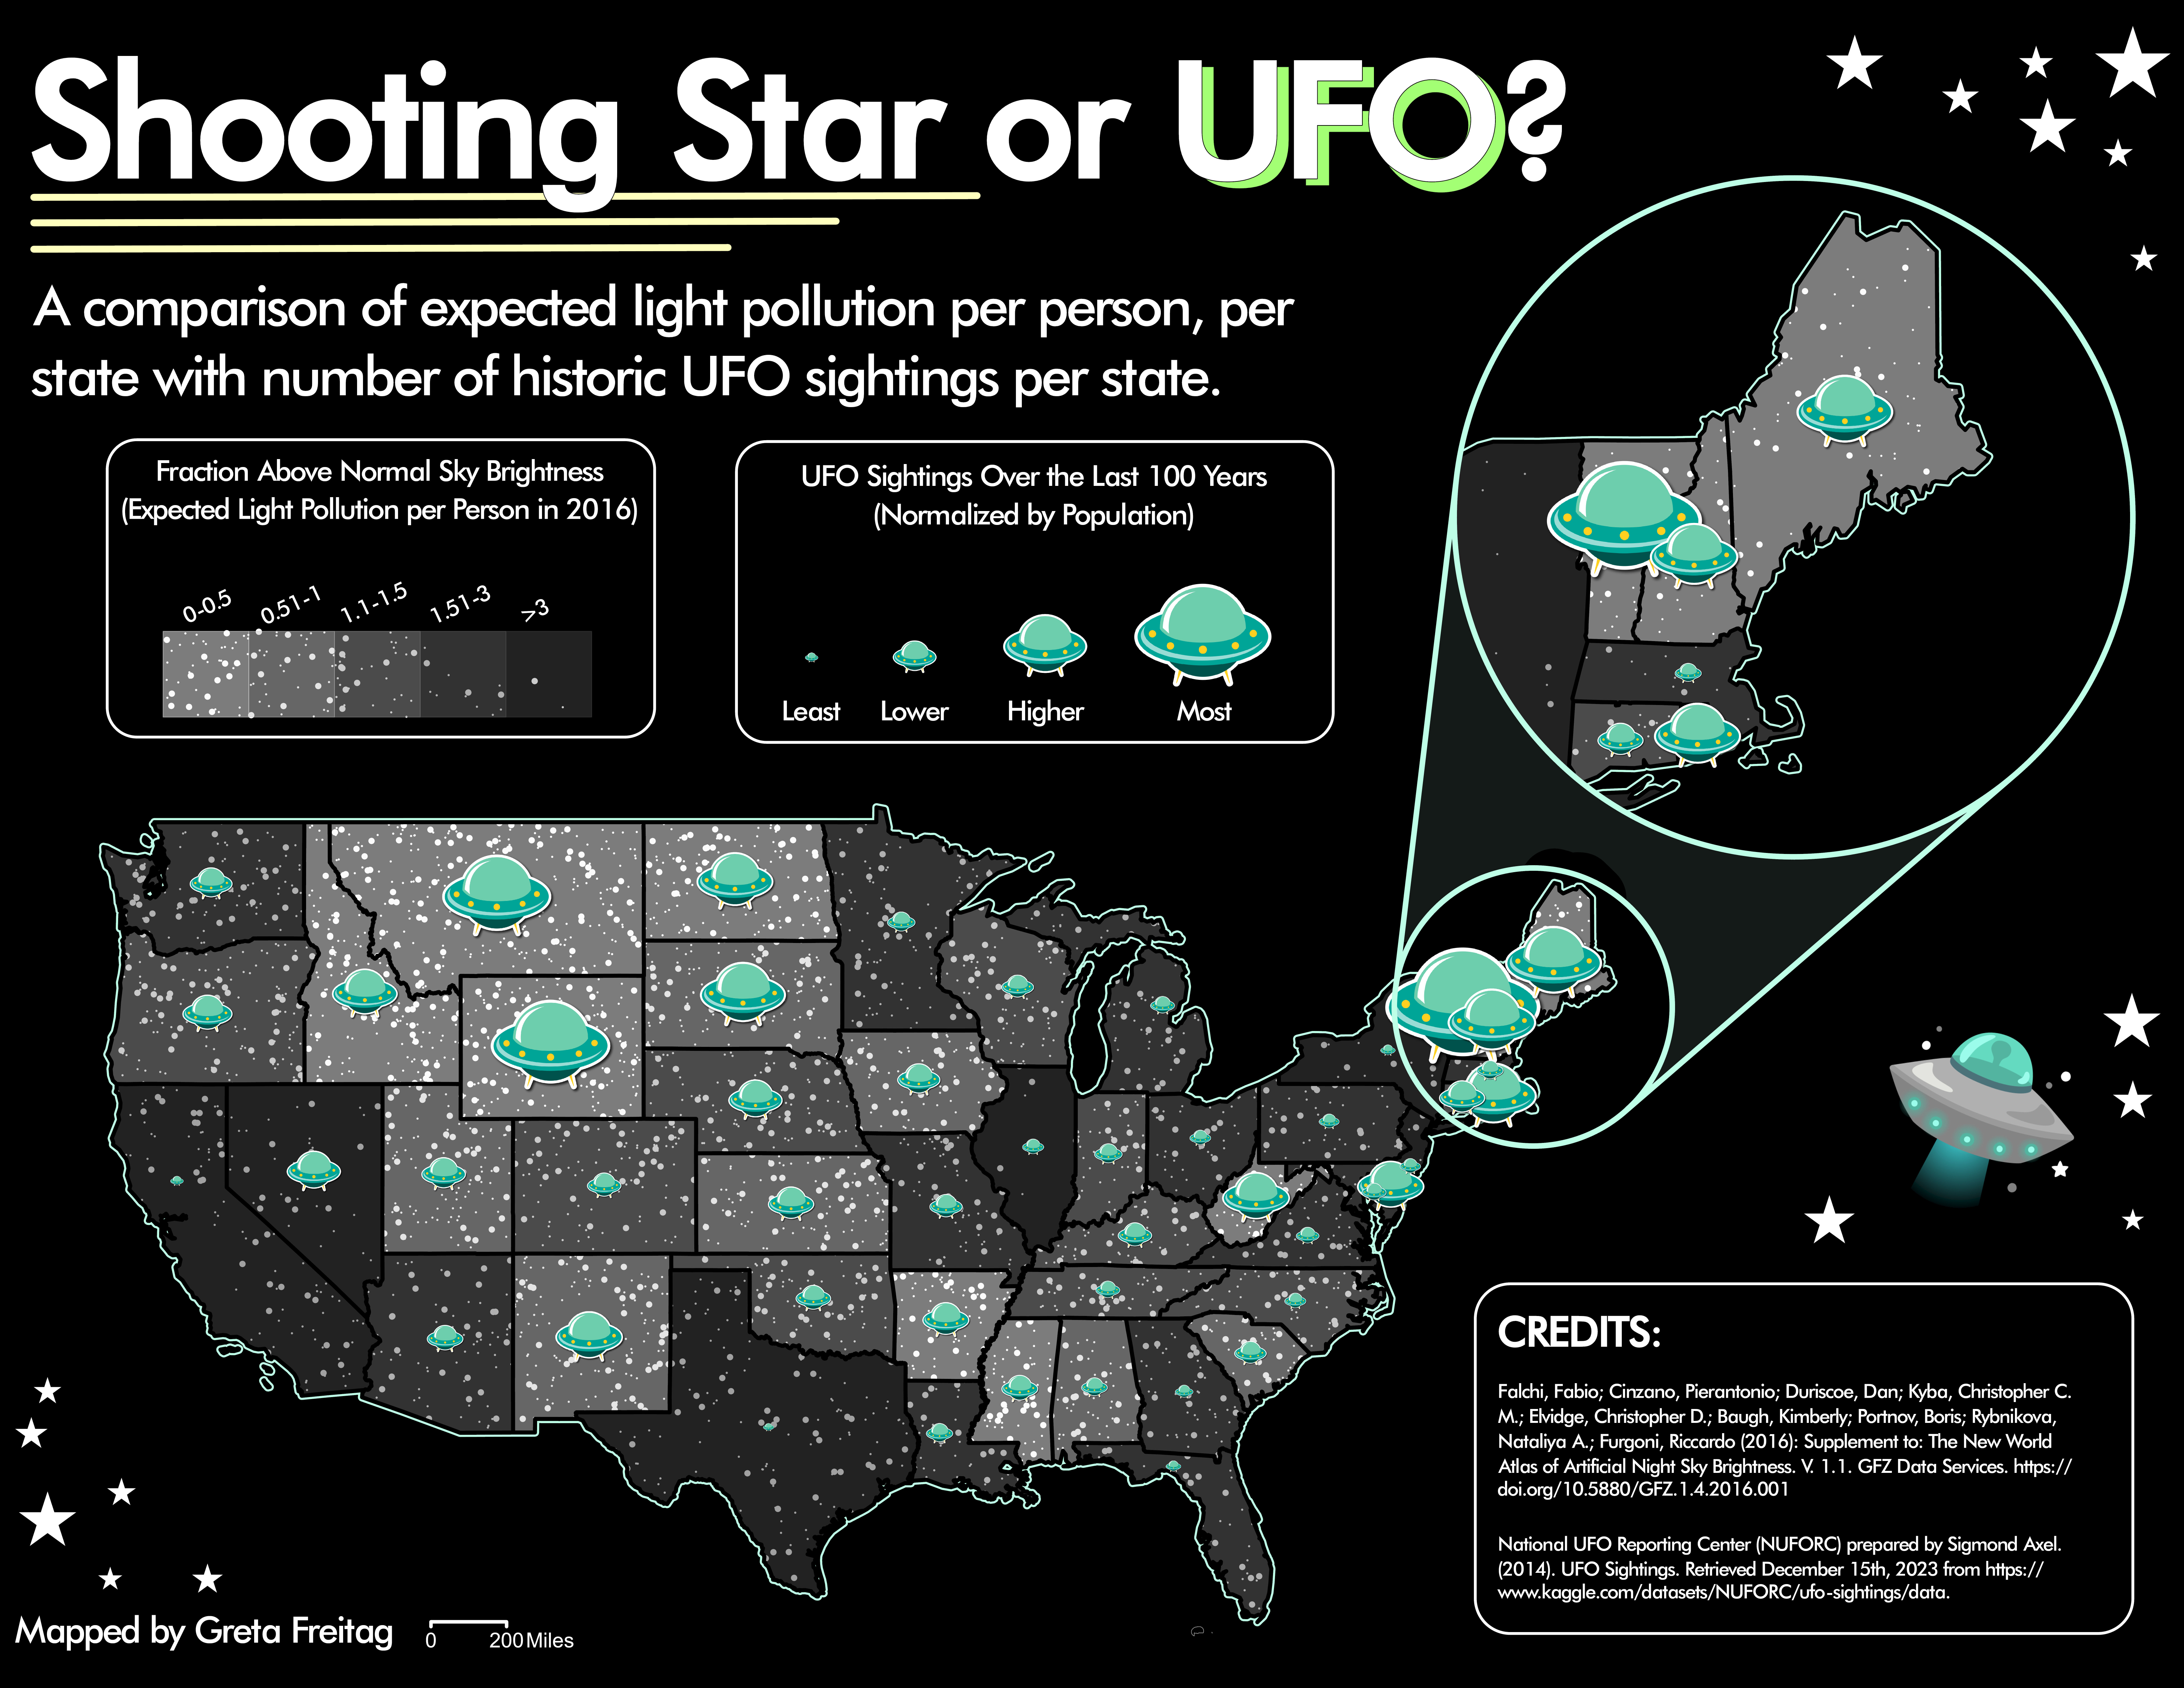
This project comes from a question that struck me out of nowhere; is there a variable that causes more UFO sightings in one place rather than another? (other than actual UFOs, of course).
I had a hypothesis that light pollution would correlate negatively to UFO sightings, since there would be fewer weird sky lights (stars and galaxies) to percieve as UFOs in areas with high light pollution.
I decided to give each state a sky brightness rating, depending on the level of light pollution the average citizen in a state would experience. Areas like California have high light pollution, since most citizens live in dense urban areas like LA or San Diego, leading to the average citizen seeing less stars. States like Montana are the opposite.
I wrote a Python script for my custom sky brightness symbology, and used proportional symbols for historic UFO sightings. The results are very clear. Areas with less light pollution get more UFO reports in proportion to their population. Except of course for Nevada, the location of area 51.